

As I explored the data for my Data Science Immersive Capstone project, I realized with much disappointment that the data was simply not as I interesting as I had hoped it might be. While there were some predictions and inferences I would be able to make, the data did not lead to much in the way of interesting data engineering nor modeling. I decided to add in data from outside sources. For my Capstone, the first idea I had was WEATHER data!
Off to Google I go. I thought I would easily turn up a BeautifulSoup script to scrape monthly weather data. No luck. So time to write my own.
As I set up the script, I ran into a number of issues.
First, pulling up Weather Underground historical data gave me empty tables. While that was frustrating, I kept digging. (I dig; sometimes that’s good, sometimes it isn’t …) I soon realized that if I went to the Spanish language site, I could get the tables. I was happy to go with that and translate a little, my daughter suggested replacing the “espanol” in the URL with “english”. I replied that it would never work. I was proven wrong. So I could reach data at an alternative URL : English Weather Underground.
With access to the correct pages, I was faced with a choice. Visit the few pages I needed (12 months and 6 cities = 72 pages) and copy/paste the tables. But that would not be satisfying.
Hello BeautifulSoup. I still was incredulous that I couldn’t turn up a script. Perhaps it is out there, but, since I’m working on developing my skills, I chose to take the time to write my own script.
Second issue. At the time of this writing, the tables are incorrectly formatted. The category “wind” is sub-labeled ‘Max’, ‘Avg’, ‘Max’:
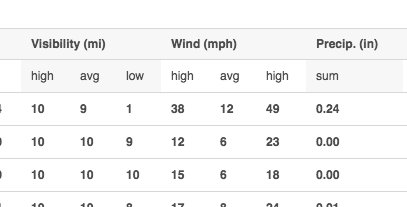
From looking at other data sources, I believe that the first two columns are ‘Max’ and ‘Avg’, but I have no idea what the third columns is. Gust?
So, to scrape the data!
First, import the regular libraries.
import requests
import pandas as pd
from bs4 import BeautifulSoup
from datetime import datetime
Then onto the logic. I needed 8 cities of data for 2 different years:
city_codes = {
    'atl' : "KATL",
    'bos' : "KBOS",
    'chi' : "KORD",
    'la' : "KCQT",
    'phl' : "KPHL",
    'sf' : "KSFO",
    'dc' : "KDCA",
    'nyc' : "KNYC"
}

start_year = 2017
end_year = 2018
First I start with creating a function that takes a start year, an end year, and a “city code” (as used on Weather underground) and ceclare the order of columns on WU. While this could be generalized, we noted above that the column names aren’t correct, so it is better to double-check.
def read_write_wx(start_year, end_year, wx_code):
    weather_cols = ["date", 'temp_max', 'temp_avg', 'temp_min', 'dew_max', 'dew_avg', 'dew_min',
                    'hum_max', 'hum_avg', 'hum_min', 'sea_max', 'sea_avg', 'sea_min',
                    'vis_max', 'vis_avg', 'vis_min', 'wind_max', 'wind_avg', 'wind_unk',
                    'prec', 'events' ]
As I dug into the html, I saw that there is little use of class and id tags, so there’s not much chance of generalizing the script. Instead, I find my way down to the correct table, and then find the data, and grab it using the order of the columns as specified.
While I had hoped to simply iterate through each column of each row, some data was missing. I generalized most of the columns, but I also added a little data cleaning for the “event” columns.
    list_wx = []
    for yr in range(start_year, end_year+1):
        for mn in range(1, 13):

            # Open wunderground.com url
            url = "http://english.wunderground.com/history/airport/" + wx_code + "/" + str(yr)+ "/" + str(mn) + "/1/MonthlyHistory.html?&reqdb.zip=&reqdb.magic=&reqdb.wmo="
            res = requests.get(url)
            res.status_code
            soup = BeautifulSoup(res.content, 'lxml')

            hist_table = soup.find_all('table', { 'id' : 'obsTable'})
            for h in hist_table:
                body = h.find_all('tbody')
                for b in body[1:]:
                    row_list = b.find_all('tr')
                    for row in row_list:
                        col_list = row.find_all('td')
                        wx = dict()
                        day = col_list[0].find('a').text
                        wx["date"] = datetime(yr, mn, int(day))
                        for i in range(1,20):
                            val = 0
                            elem = col_list[i].find('span')
                            if elem:
                                val = elem.text
                            wx[weather_cols[i]] = val
                        events = "None"
                        elem = col_list[20]
                        if elem:
                            events = elem.text.strip()
                            events = events.replace('\t','')
                            events = events.replace('\n','')
                            if len(events) == 0:
                                events = "None"
                        wx['events'] = events
                        list_wx.append(wx)
To close out the function, I casted my list of dictionaries (each element of the list corresponds to a day of weather data) into a Pandas DataFrame.
To run the whole thing, we call the function, looping through the cities in order to create a separate CSV file for each:
for city, wx_code in city_codes.items():
    df = read_write_wx(start_year, end_year, wx_code)
    df.to_csv('../data/' + city + '/weather.csv', index=False)
And I now have two years of weather data for each of the 8 cities on my list.